Super Cool Tools: Older Americans 2016
We’ve all heard about the age wave – but what does the picture actually look like for older adults in the US?
About this presentation:
![]() Listen now to the Coffee Break, from Nov. 4, 2016, when Kristin introduced the “Older Americans 2016: Key Indicators of Well-Being.” Using national data, this report provides data visualizations and explanations that summarize key indicators in six different areas – population/demographics, economics, health status, health risks and behaviors, health care, and environment. To use the authors’ words, it “provides a comprehensive, easy-to-understand picture of our older population.” There is also a special section on family caregivers. She talks about what is included in the report and how educators may want to use it.
Listen now to the Coffee Break, from Nov. 4, 2016, when Kristin introduced the “Older Americans 2016: Key Indicators of Well-Being.” Using national data, this report provides data visualizations and explanations that summarize key indicators in six different areas – population/demographics, economics, health status, health risks and behaviors, health care, and environment. To use the authors’ words, it “provides a comprehensive, easy-to-understand picture of our older population.” There is also a special section on family caregivers. She talks about what is included in the report and how educators may want to use it.
Handout to follow along while you listen: Super Cool Tools: Older Americans 2016.
For localized data:
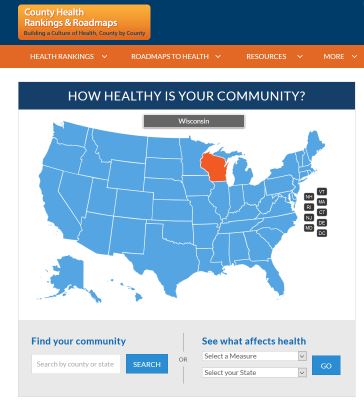 – County Health Rankings: Find out how healthy your county is and explore factors that drive your health.
– Wisconsin Interactive Statistics for Health (WISH): This site gives you information about health indicators (measures of health) in Wisconsin. WISH allows policy makers, health professionals, and the public to submit questions (requests for data) and receive answers (tables) over the Internet.
– Applied Population Lab’s GetFacts: Check out the first Coffee Break for navigating APL.
– Tips and resources for the Institute for Research on Poverty: In this FAQ, you will find some basic information about sources of local data that are available on-line for the midwestern region, in a form reasonably accessible by nonspecialists.
And back to that age wave:
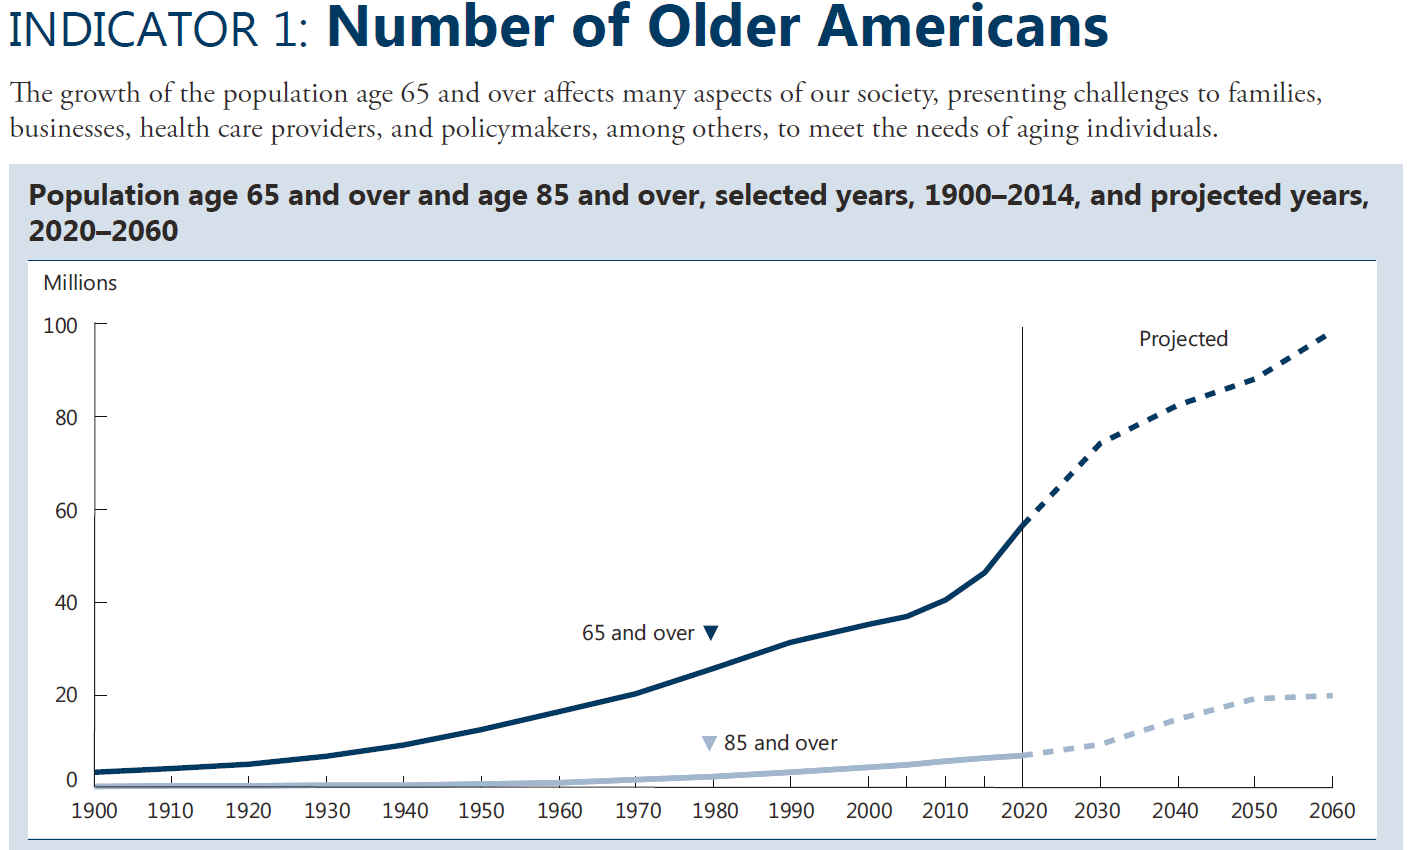 Click image to see full screen!